See how every route really went
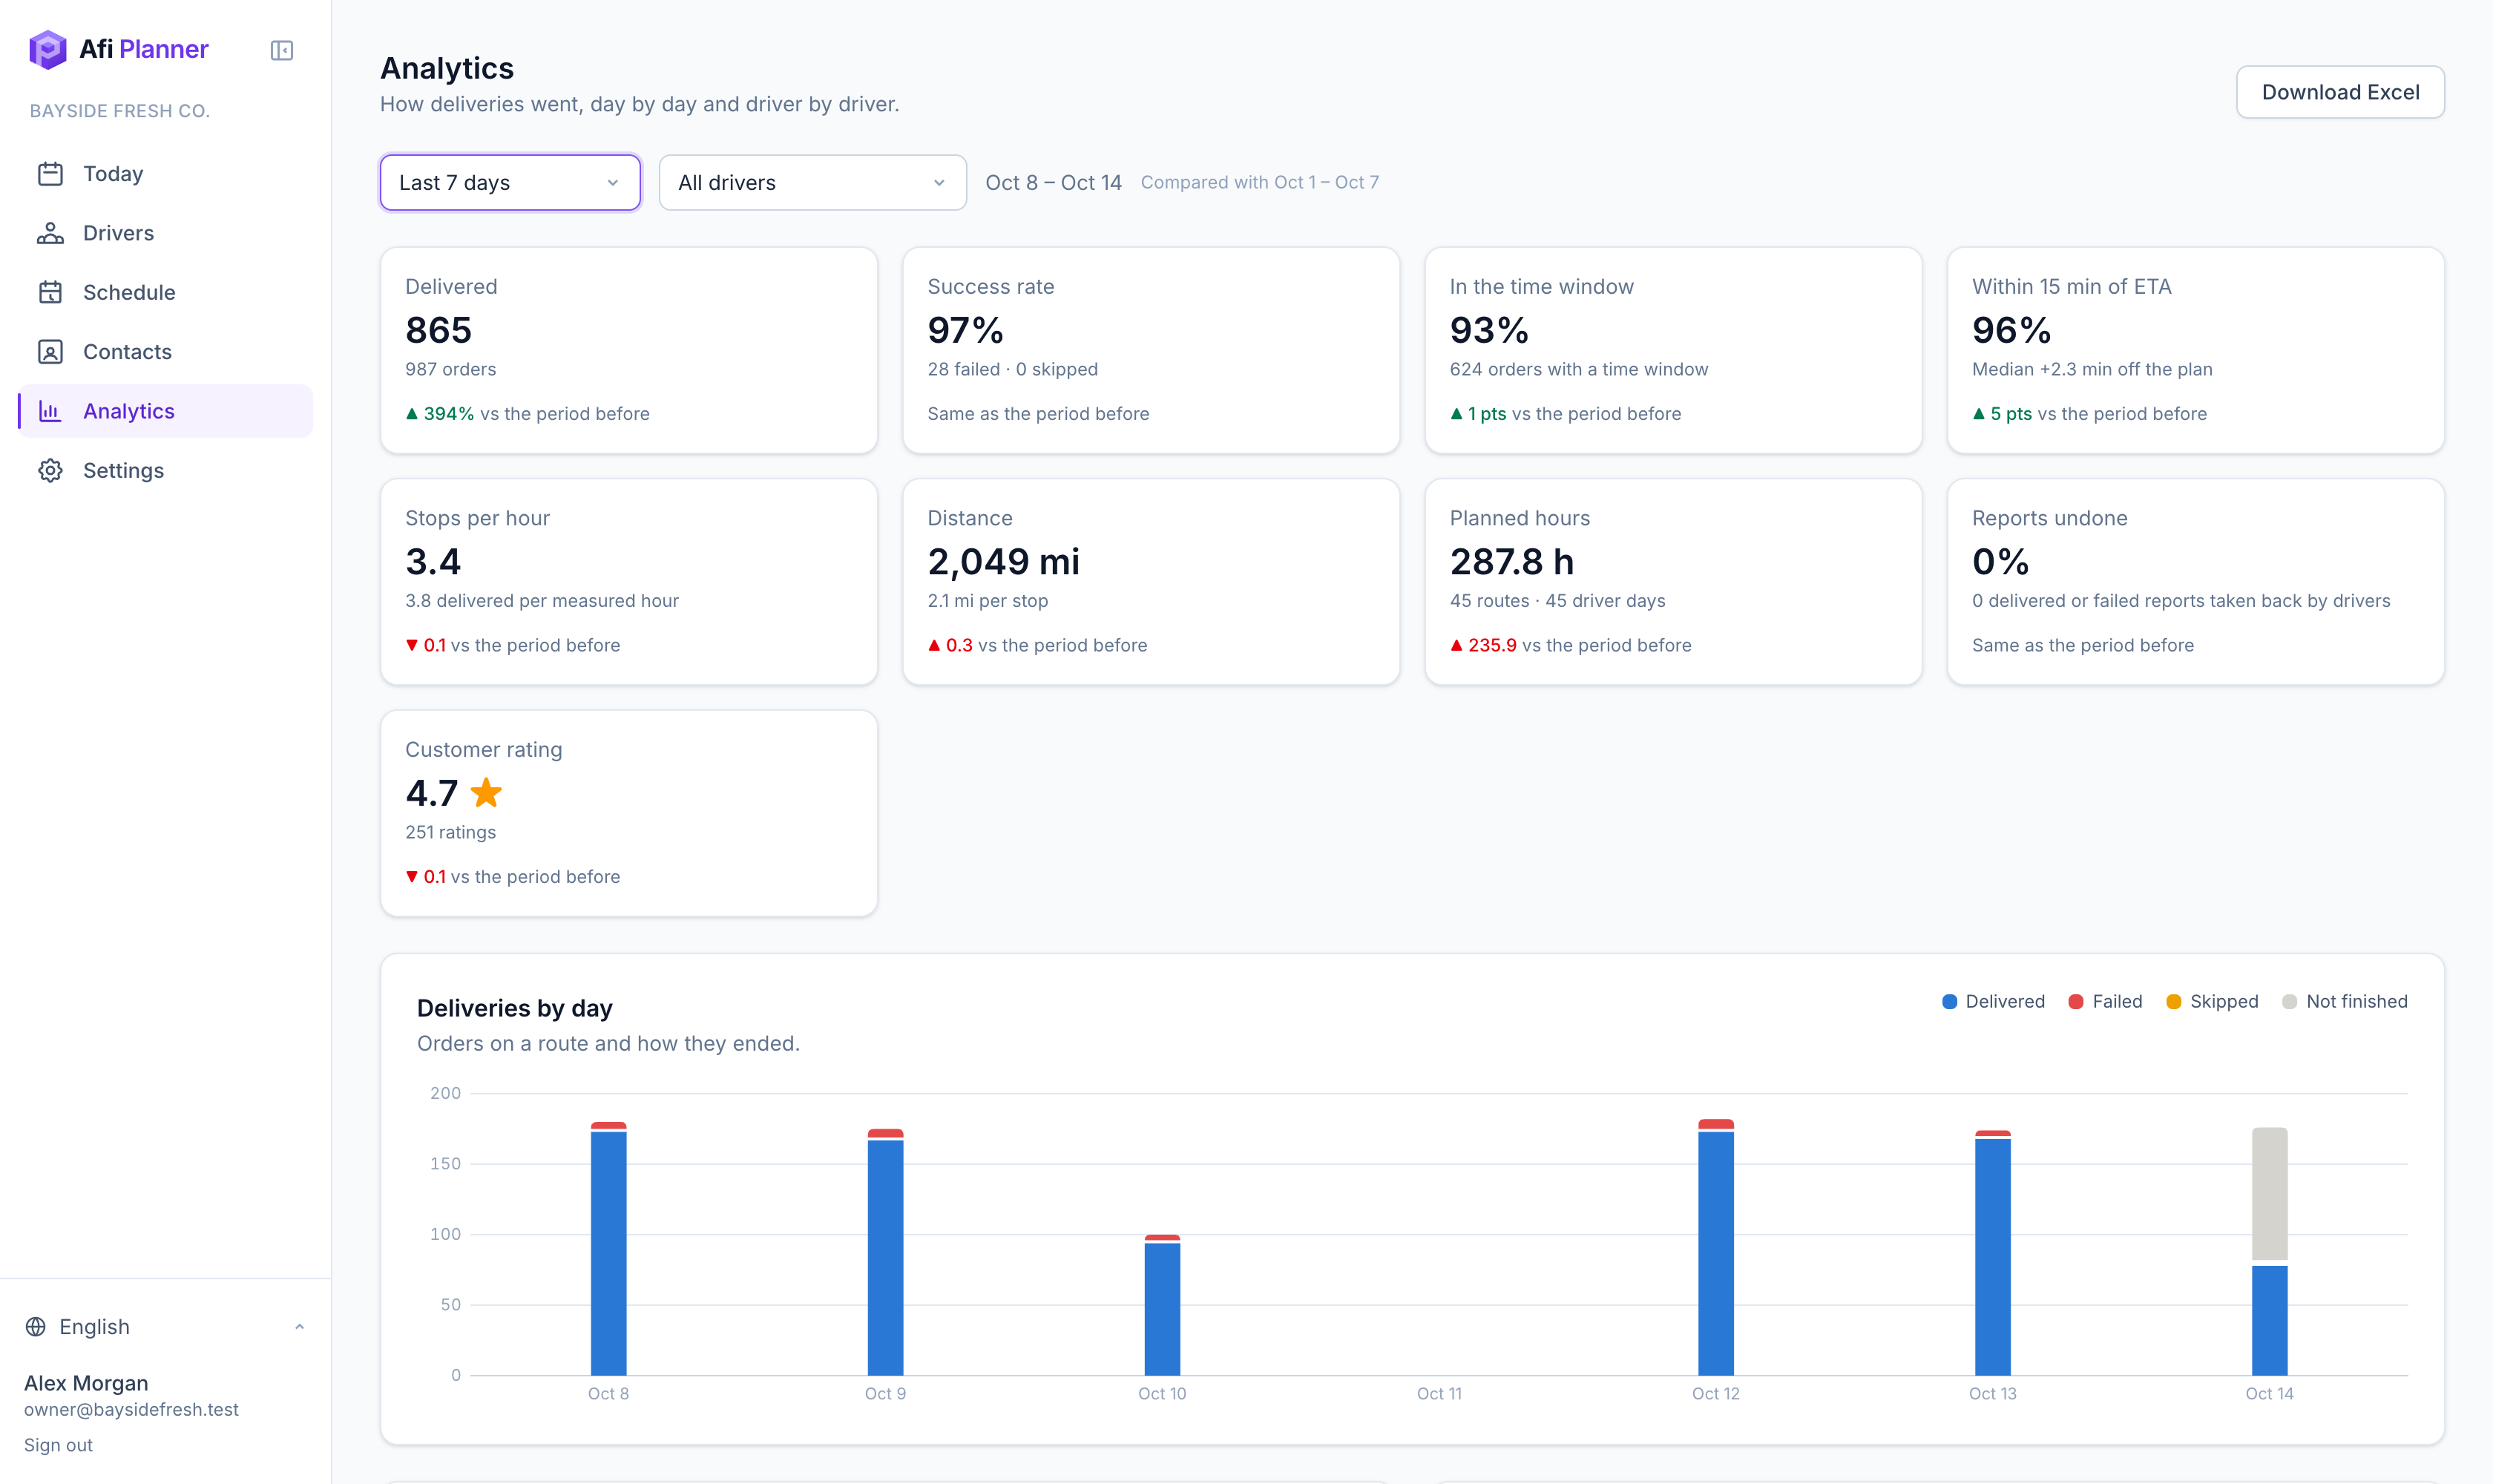
Afi Planner compares what was planned with what happened. On-time rate, ETA accuracy, stops per hour and customer ratings, for the whole team and for each driver, with the reasons behind every failed delivery.
Numbers you can act on
Time windows kept, ETA accuracy and stops per hour show where the plan and the street disagree.
Fair driver comparisons
Each driver’s results next to their planned work, measured hours and customer ratings.
Excel in one click
Download by day, by driver and by order, ready for payroll or a client report.
Every plan, explained
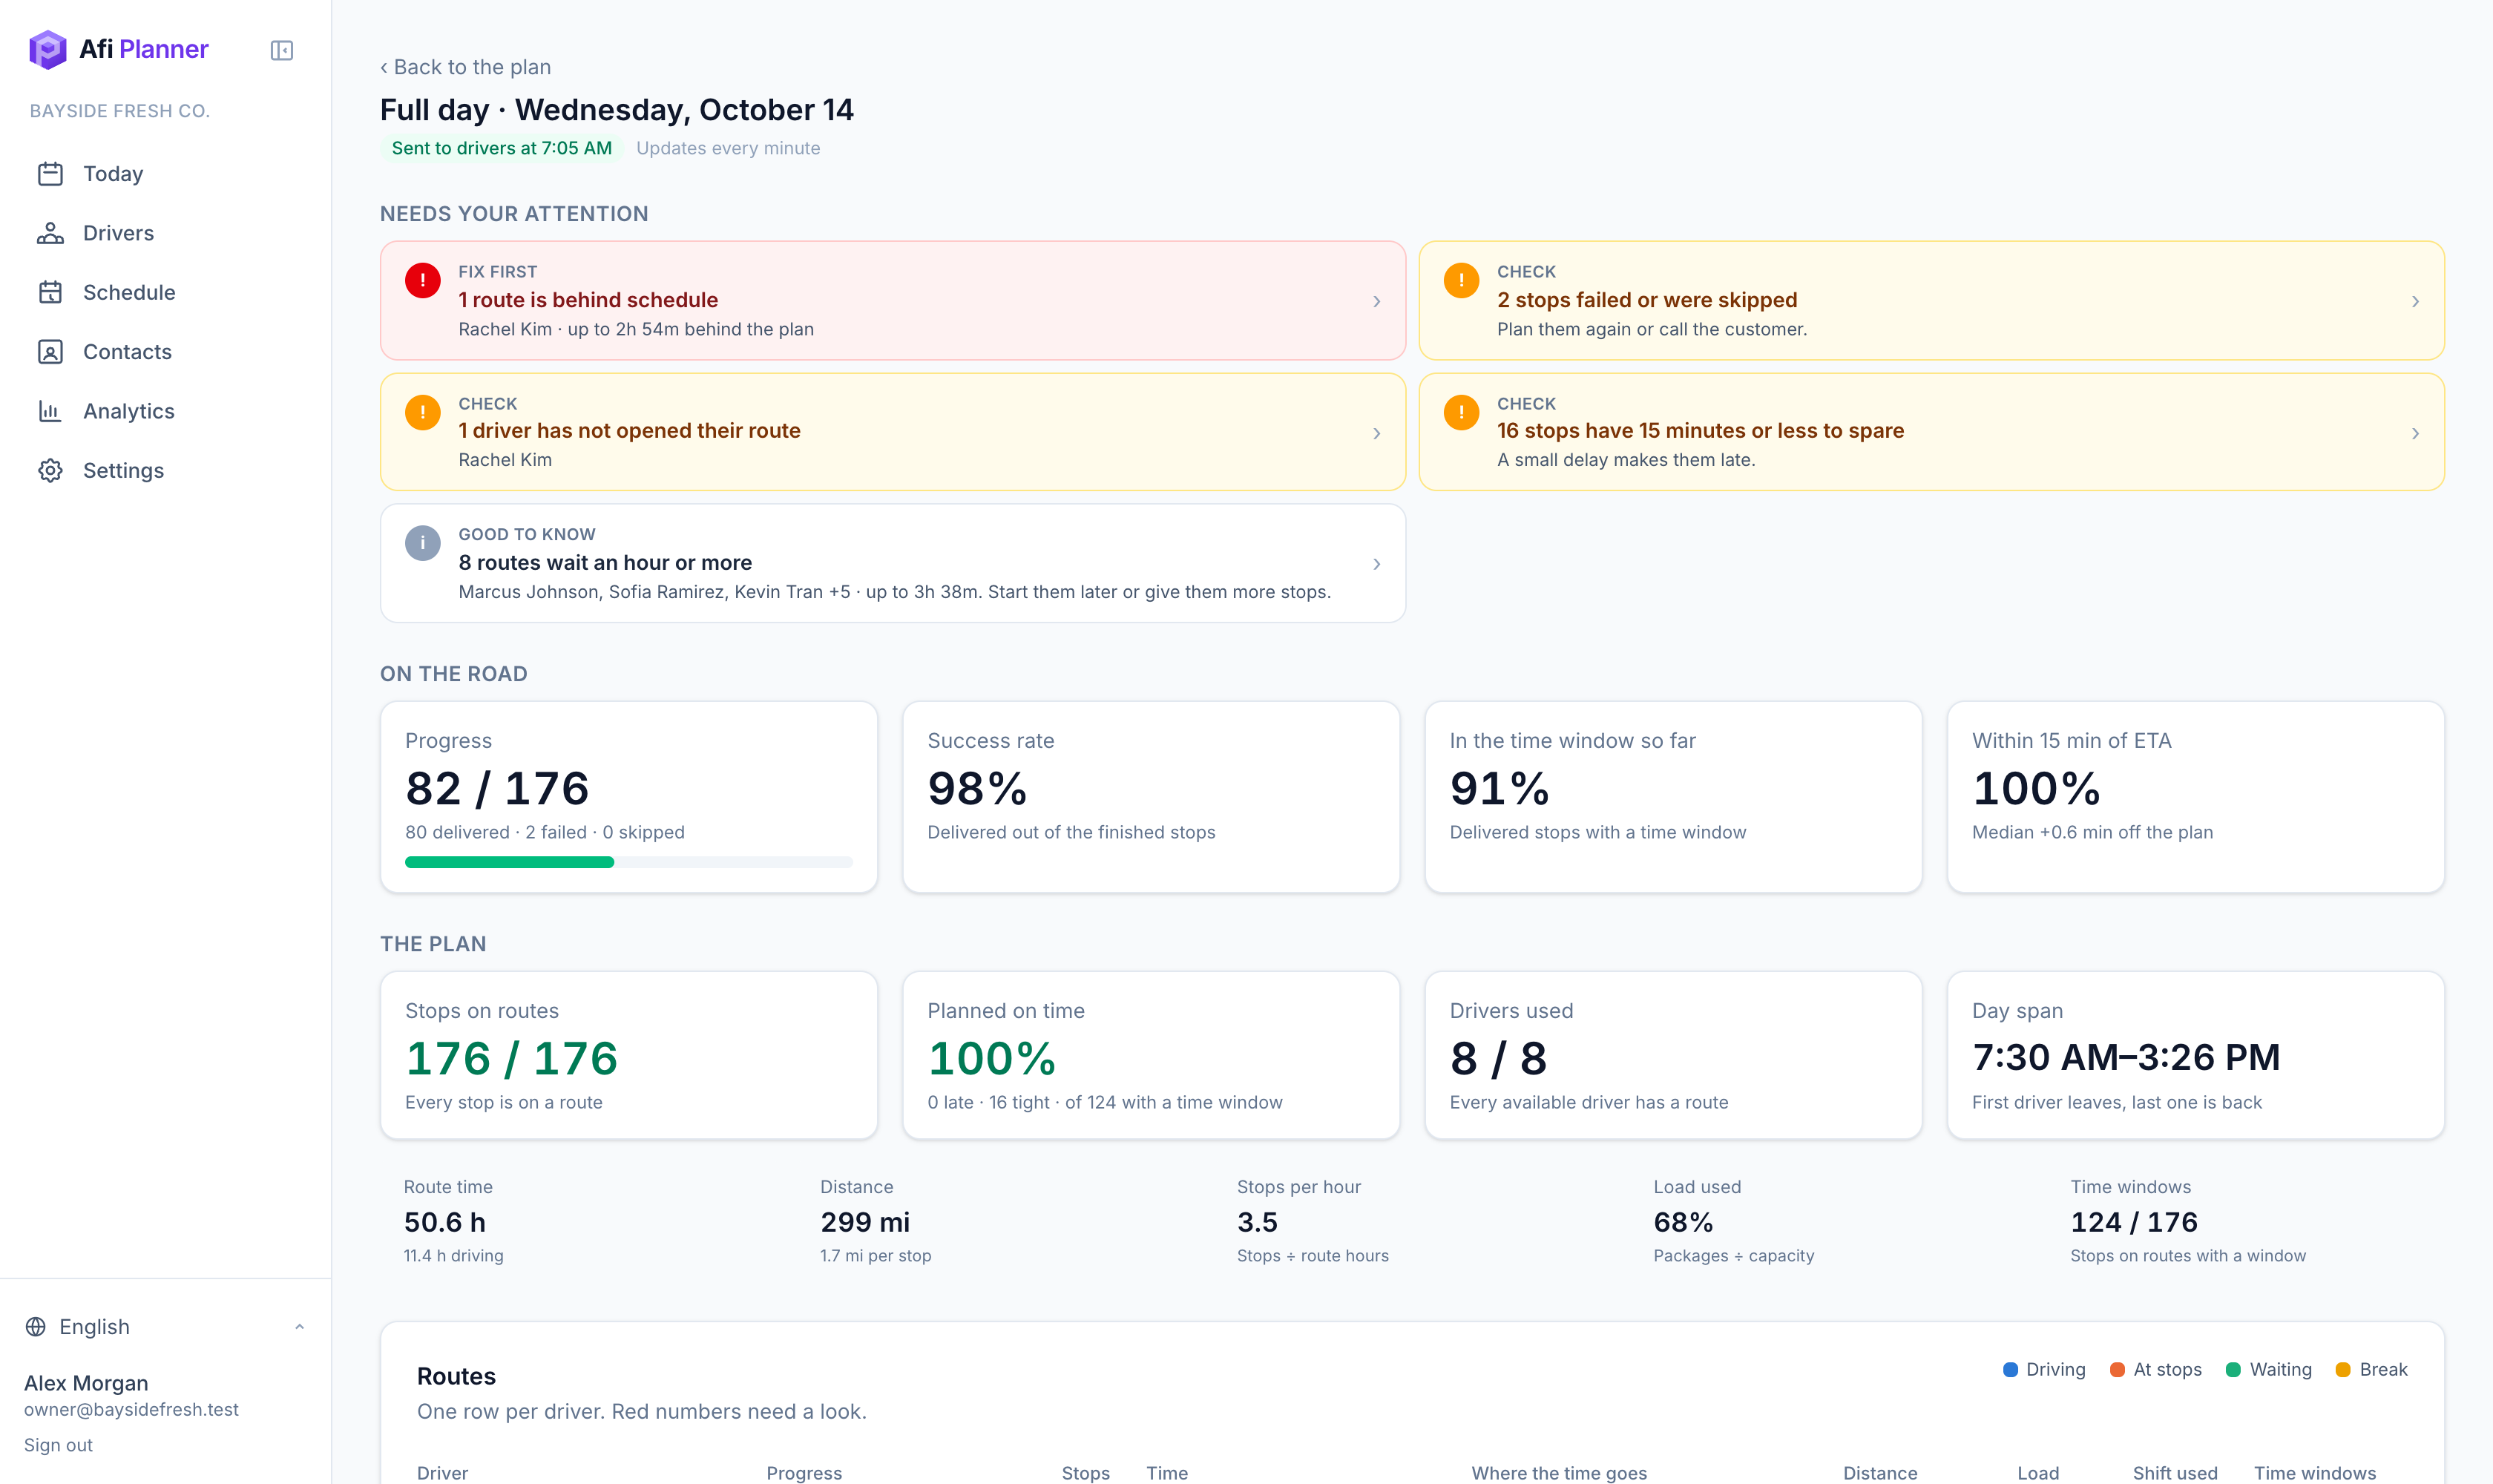
Open any day to see alerts first (late, failed, over limits, idle drivers, uneven routes), then each route’s time split between driving, stops and waiting.
Click a number, see the orders
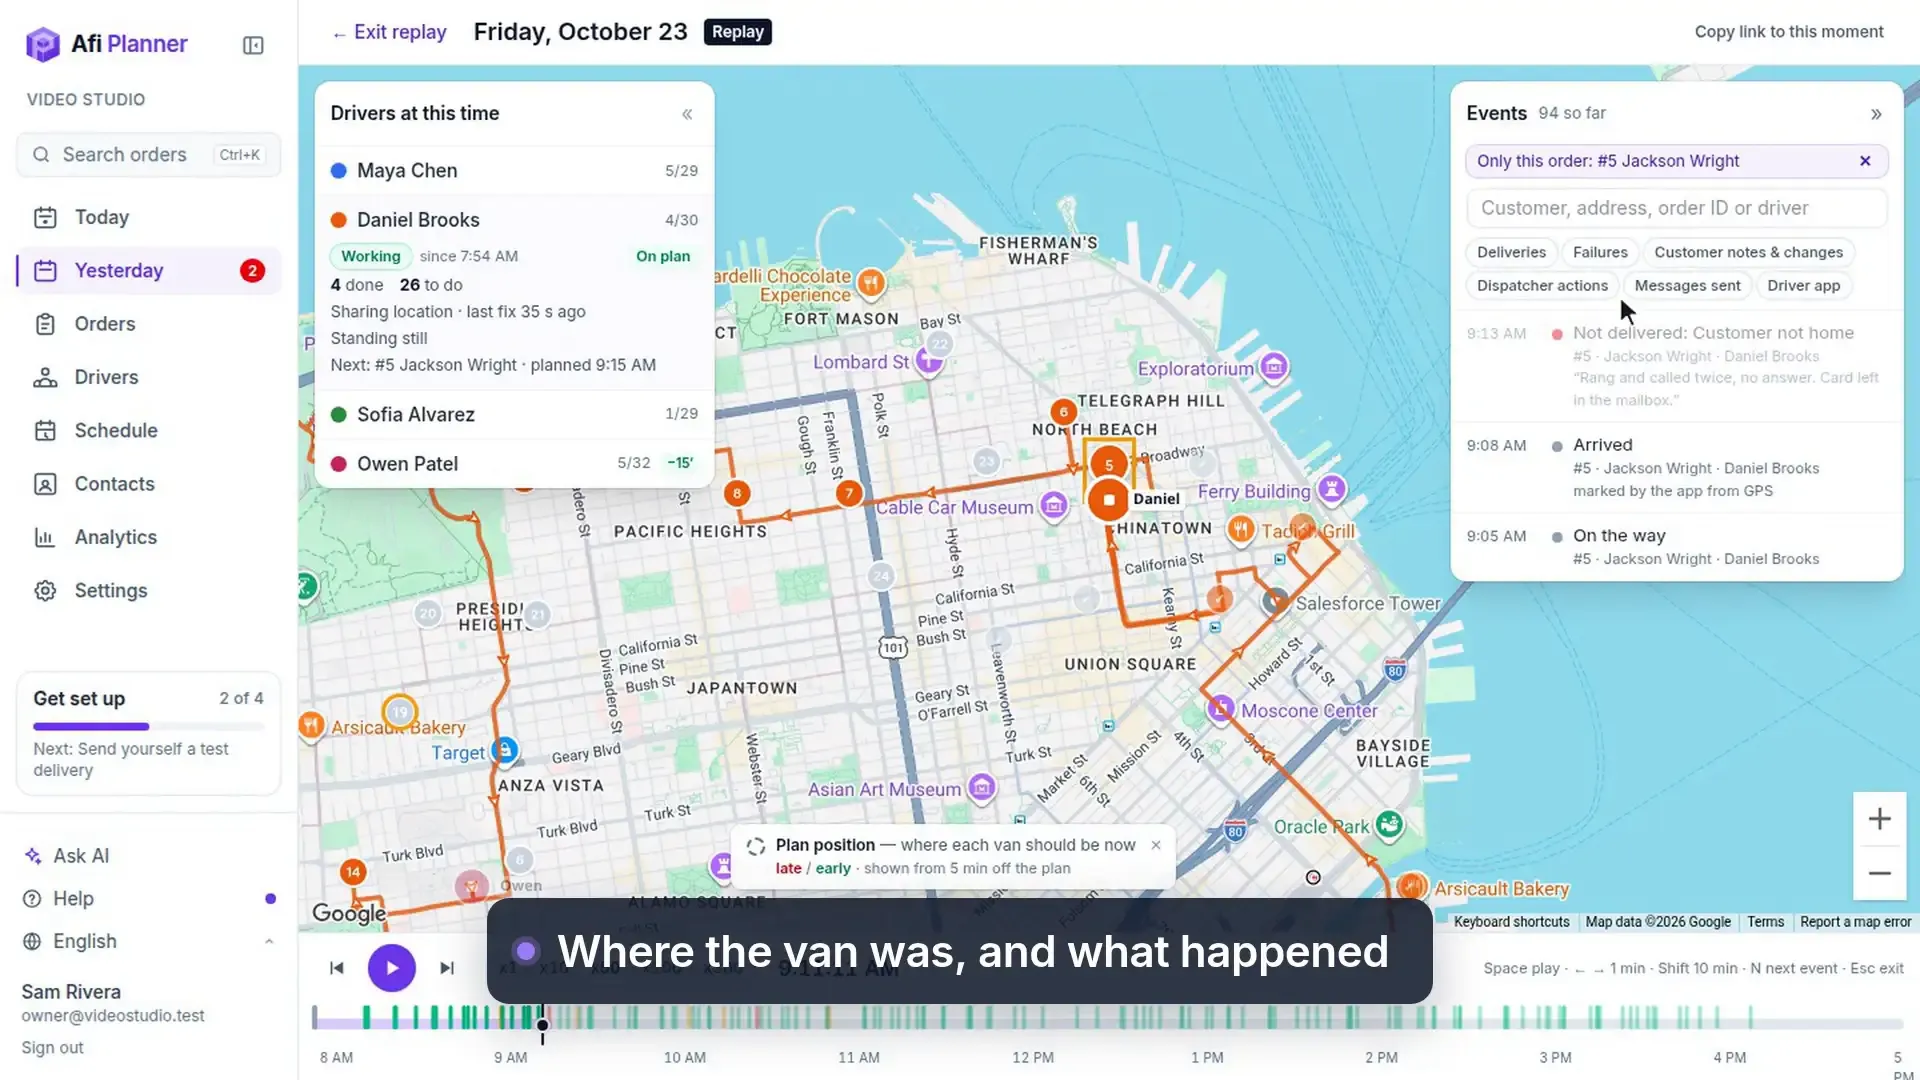
Every count opens the orders behind it: failed, skipped and not attempted deliveries, late and early arrivals, each failure reason and the reports made with no visit on the GPS track. Each order opens its history, or replays the day just before the driver reported, so “6 failed” becomes six answers in two clicks.
- Recent reviews list the low ratings first, each with the replay a few minutes before the delivery
- On a day’s analytics, a stop opens on the board or in the replay at its arrival, and a driver’s name opens their route
- A day in the charts opens that day
- Canceled orders and the cancel rate sit on the Delivered tile, and “Why orders were cancelled” counts each reason; click either to see the orders
Spot patterns over weeks
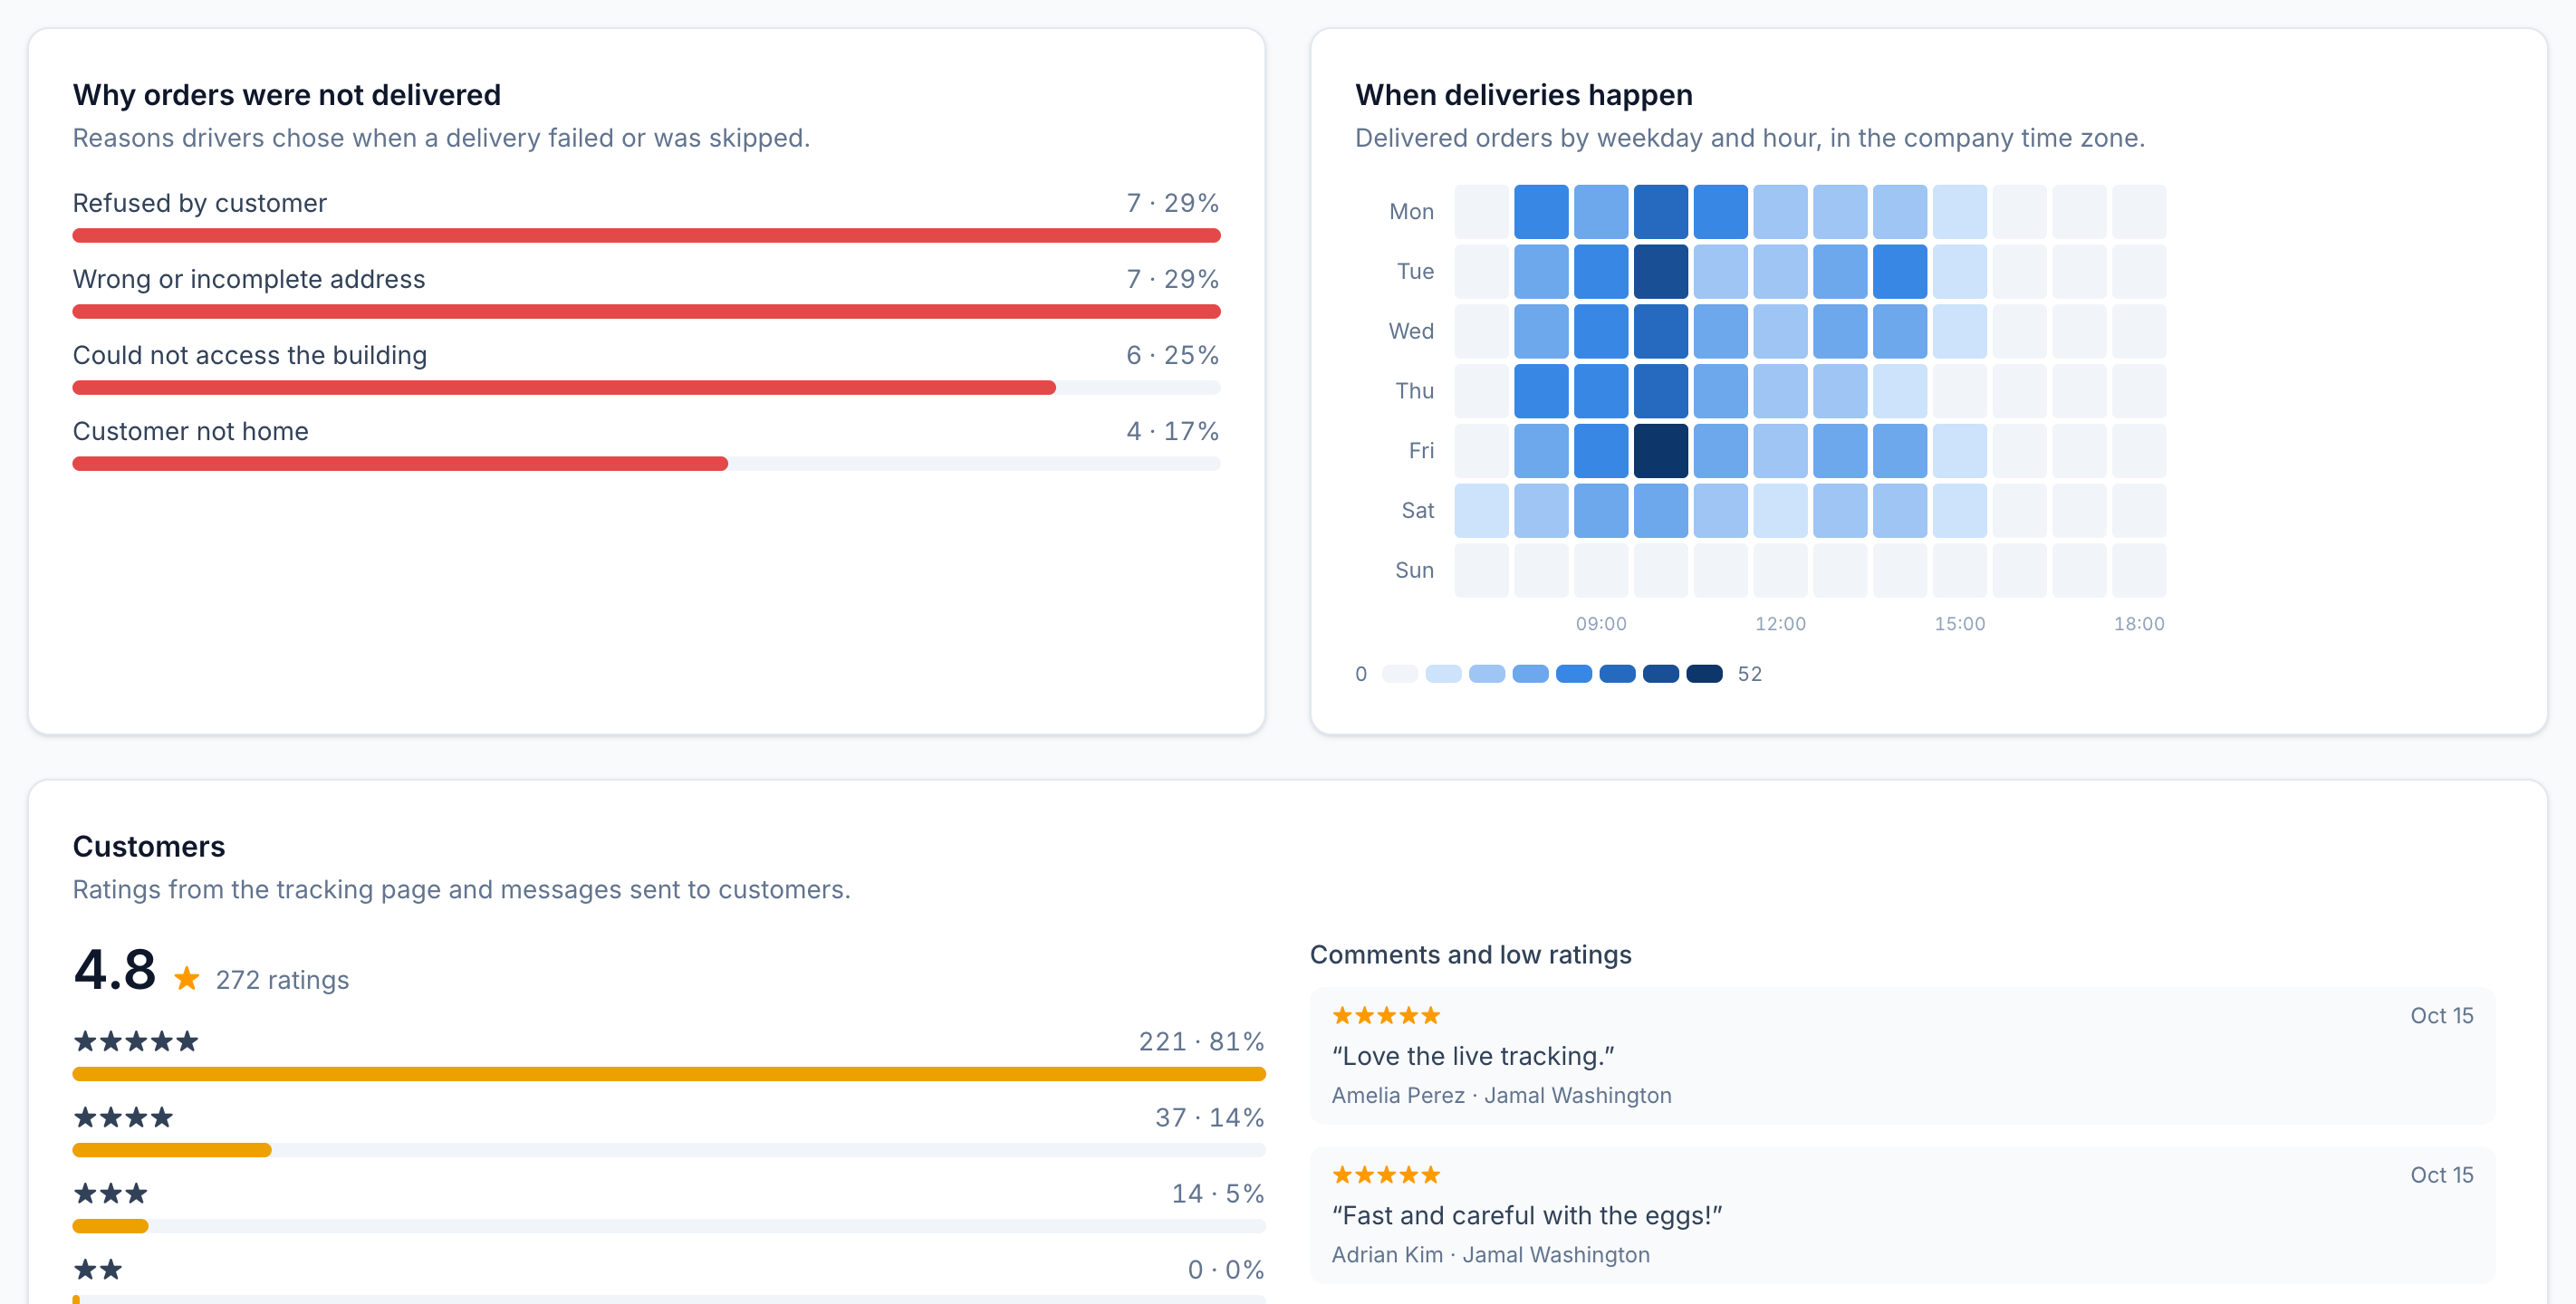
Outcomes per day or week, failure and skip reasons, a weekday-by-hour heatmap and customer comments, compared with the period before.
What each stop really costs
Cost per stop is worked out from the hours and miles your drivers really drove, from their reports and GPS, at the cost per hour and per mile you set in Settings. Where a route wasn’t measured, the plan’s hours and miles are used, and the page says which.
- Cost per delivered stop, and what failed deliveries cost you, including the deliveries made again after a failure
- Cost by day and by driver, filtered by driver, label, ZIP or customer
- Compare with what a stop cost you before, clearly marked as your estimate
- Download the costs to Excel, one row per attempt
Travel times learned from GPS
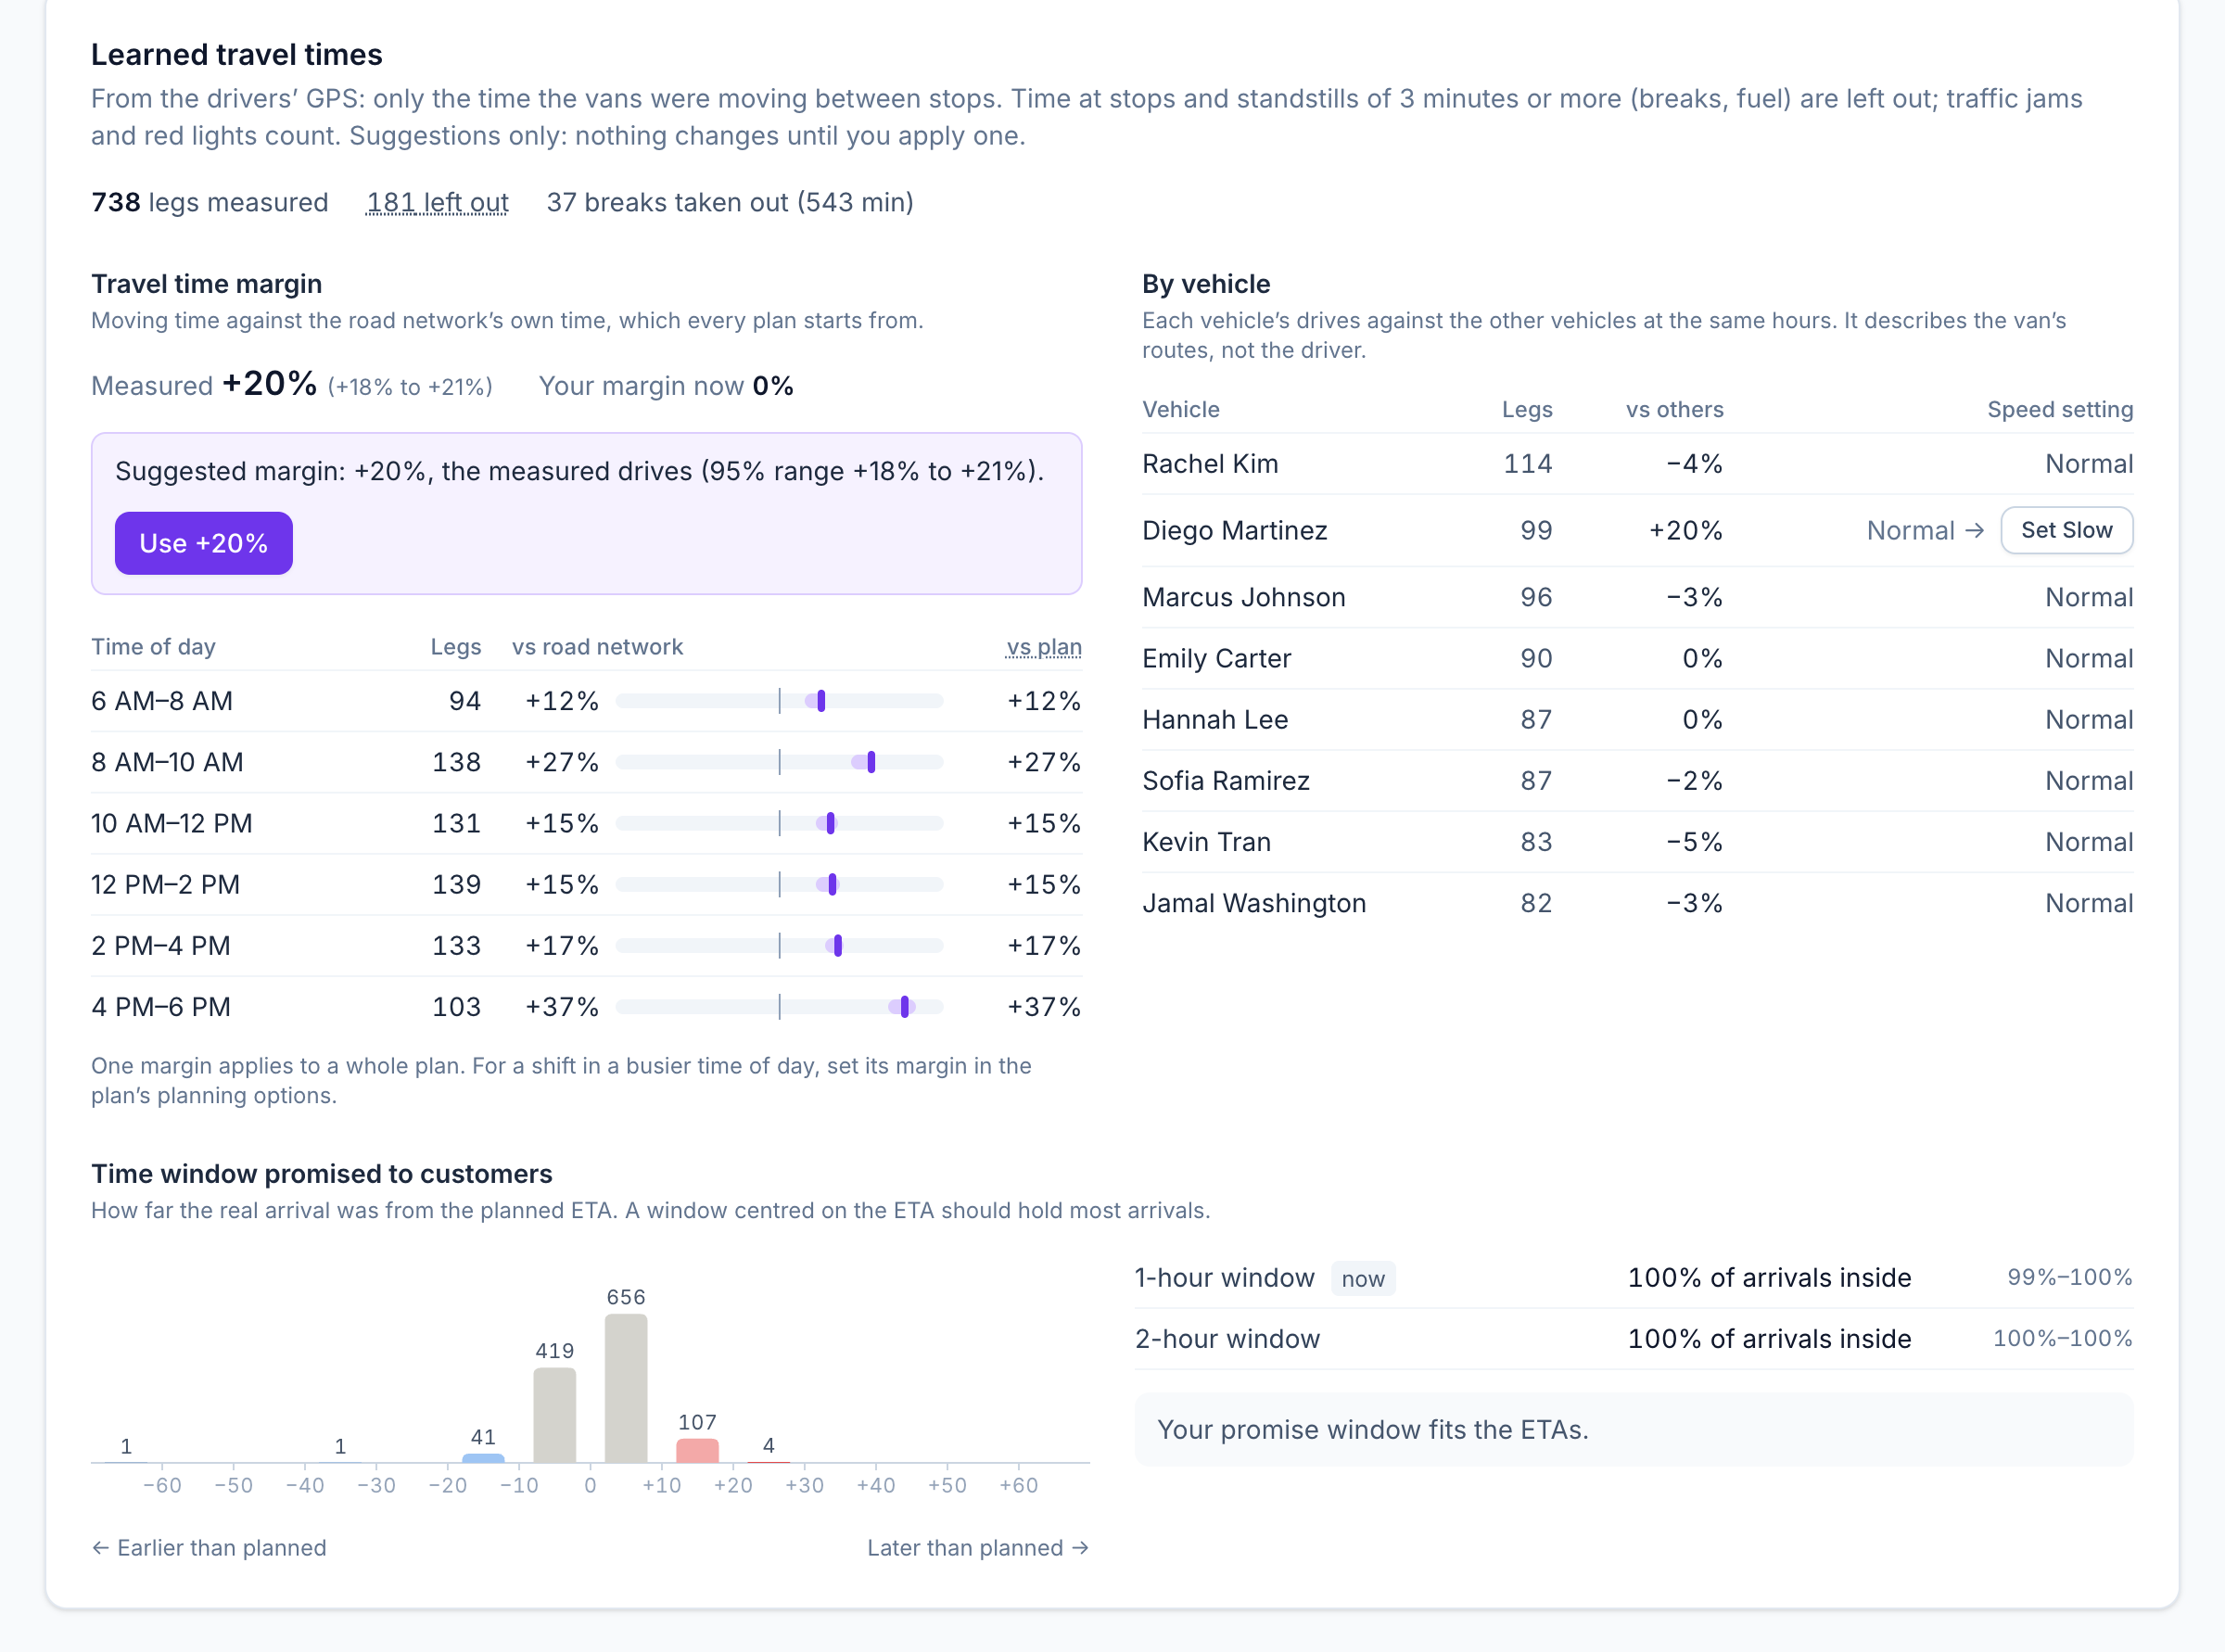
Afi Planner measures how long your vans really take between stops, from the drivers’ GPS, against the time the plan gave them. Only moving time counts: time at the stop and standstills of 3 minutes or more (a coffee, fuel) are left out, while traffic jams and red lights stay in, because that is the traffic you plan for. Plain statistics you can check, not a black box. Once enough drives are measured, Analytics suggests a travel time margin with its 95% range. Nothing changes until a dispatcher applies a suggestion.
- A suggested margin only after at least 20 measured drives, with a button to use it
- The margin by 2-hour window, to set a busier shift’s margin in its planning options
- Each van’s drives against the others at the same hours, with a speed setting to apply
- How far real arrivals were from the planned ETA, and whether a 1- or 2-hour promise window holds them
- Only the people who plan routes see these numbers
Step-by-step guides
Frequently asked questions
Can I export the data?
Yes. Analytics downloads as an Excel file with By day, Drivers and Orders sheets, and every plan exports routes to Excel.
More features
- Route optimizationOptimized routes that respect how your day really worksLearn more
- Dispatch & live trackingKnow what needs you before your phone ringsLearn more
- Driver appA driver app built for the curb, not the officeLearn more
- Customer trackingFewer “where’s my order?” callsLearn more
- Driver pay & timesheetsDriver pay worked out from the routes they droveLearn more
- Integrations & APIConnect your systems in both directionsLearn more
- Import & addressesFrom spreadsheet to map in secondsLearn more
Plan tomorrow’s routes in the next 3 minutes
Start your free 3-month trial. No credit card, no setup call, no installation.