Analytics, reports and Excel exports
4 steps3 min read
Find out how the plan compared with the street, and share it.
Step 1: Pick a period
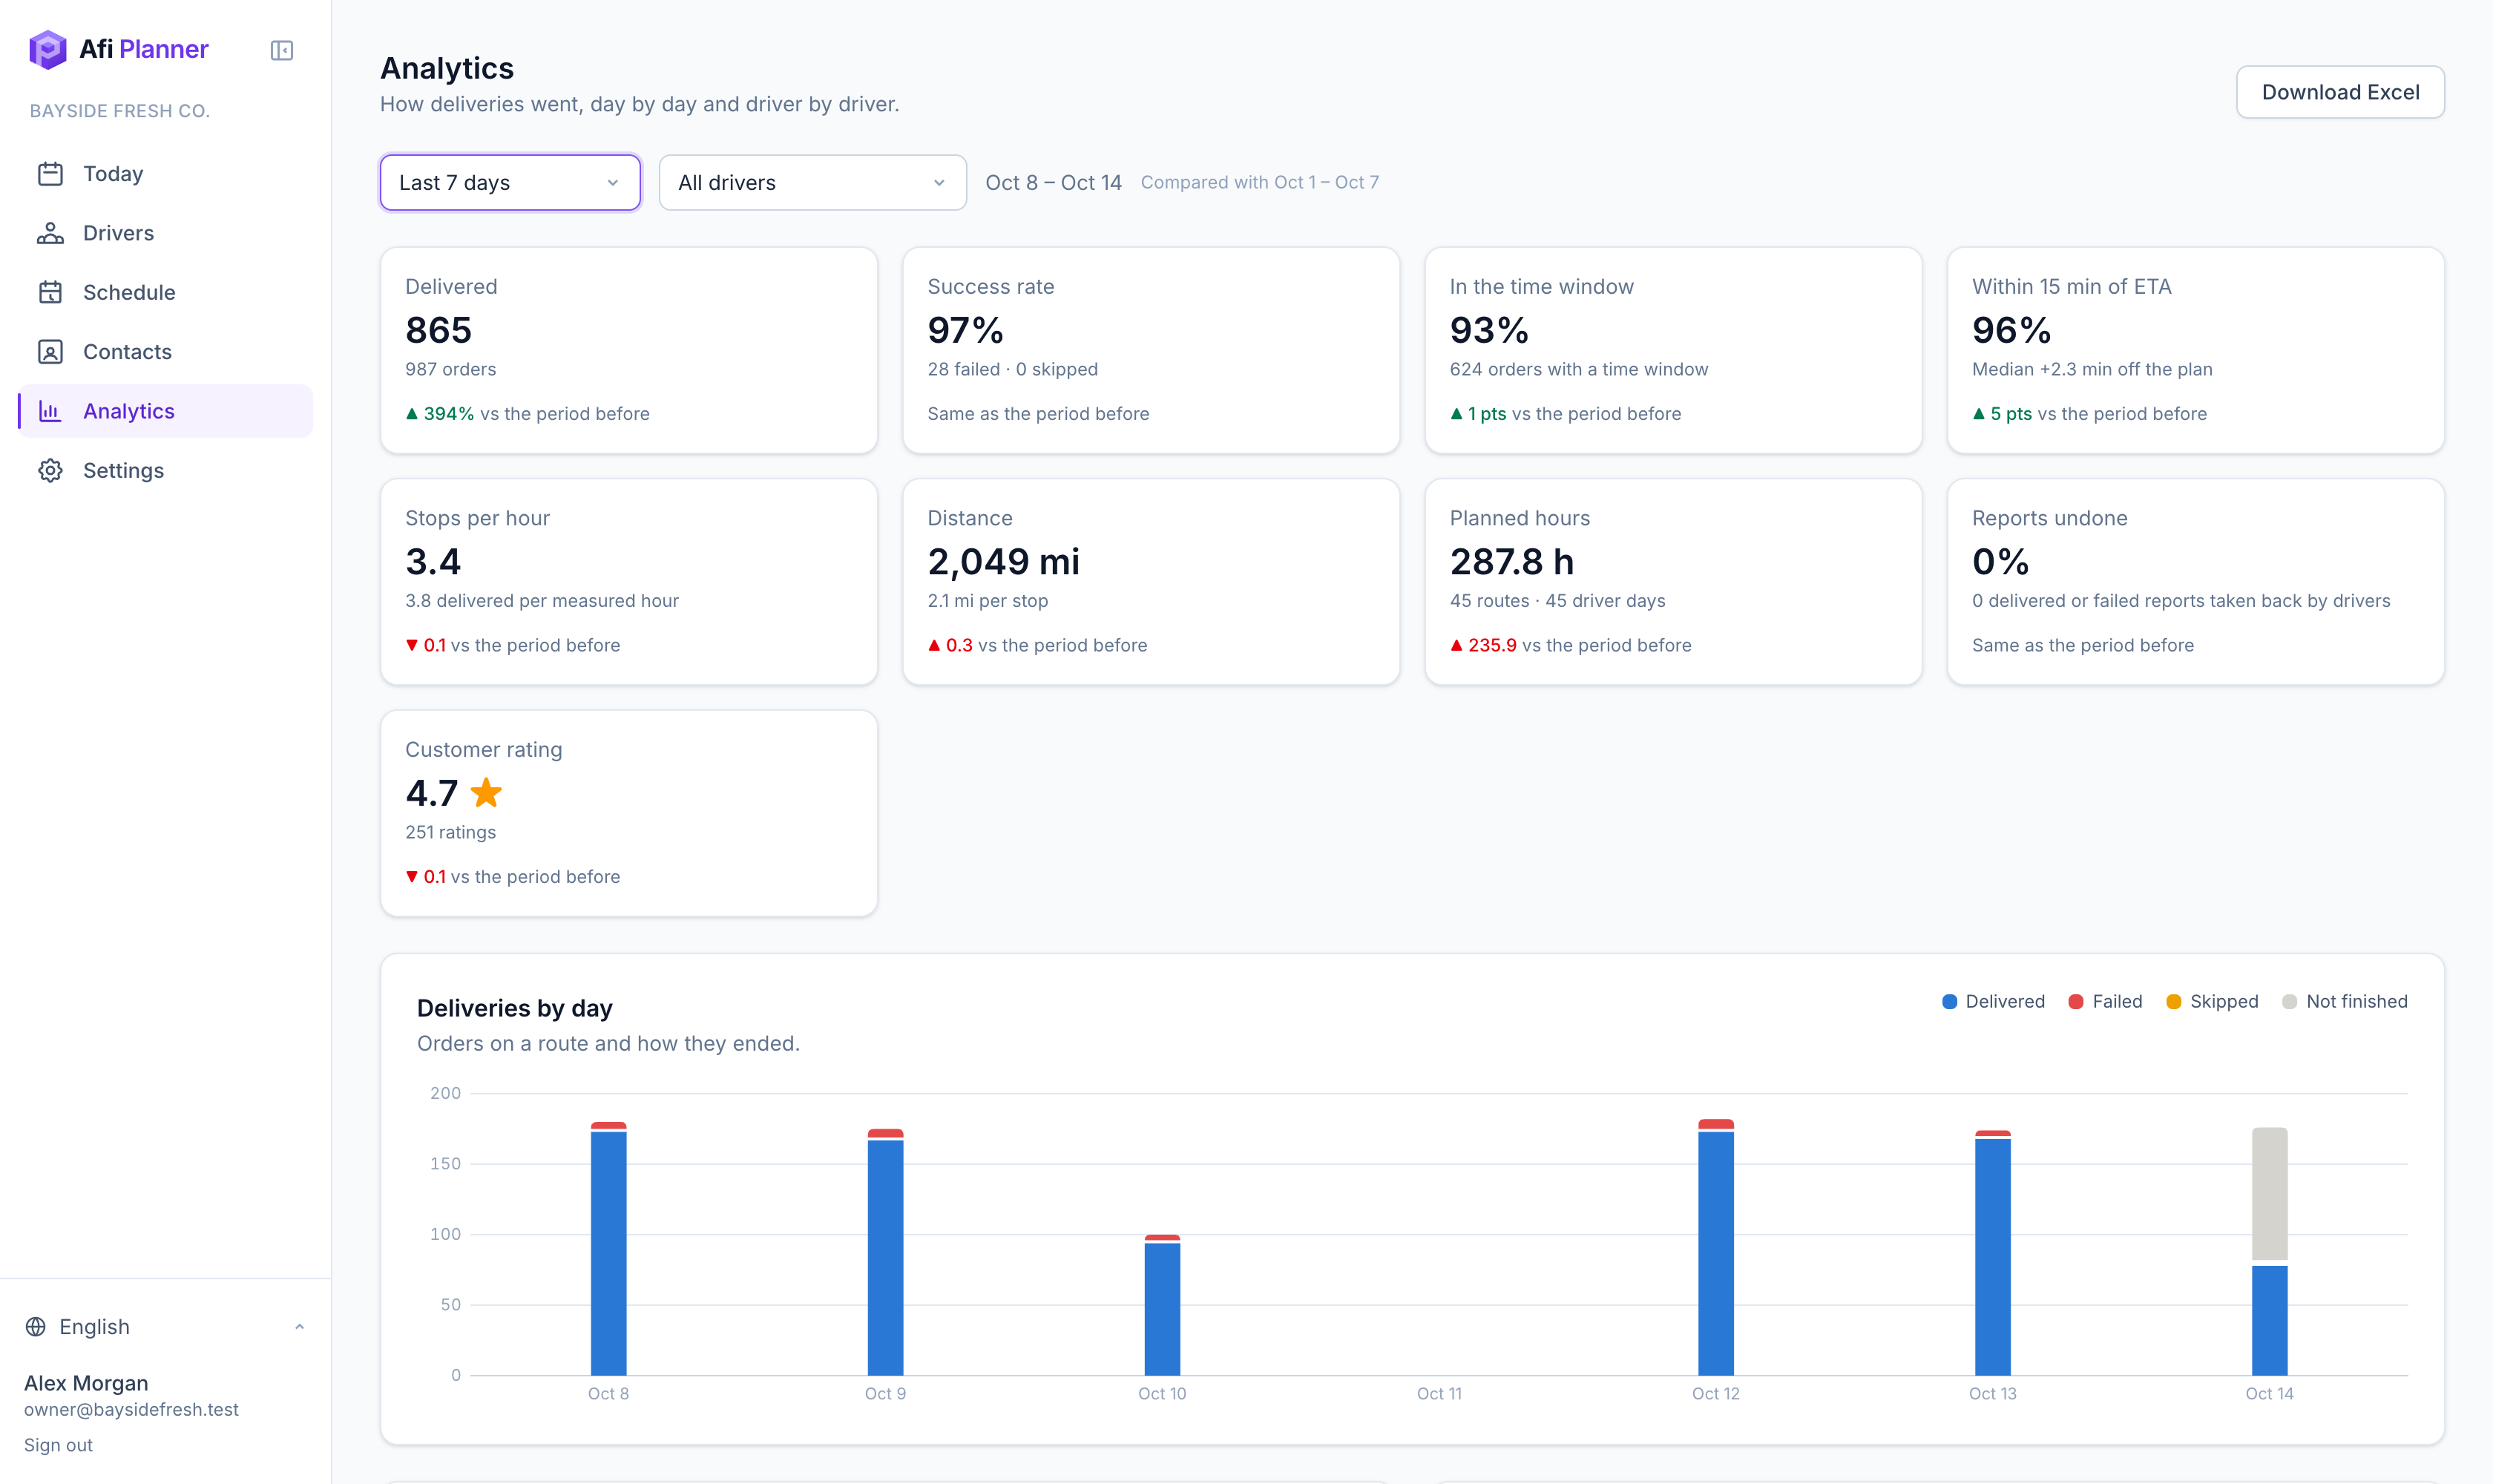
Open Analytics and choose a period and, if you like, one driver. Each number is compared with the period before.
Step 2: Read the key numbers
Delivered, success rate, time windows kept, ETA accuracy (within 15 minutes), stops per hour, miles, planned hours and customer rating.
Step 3: Dig into one day
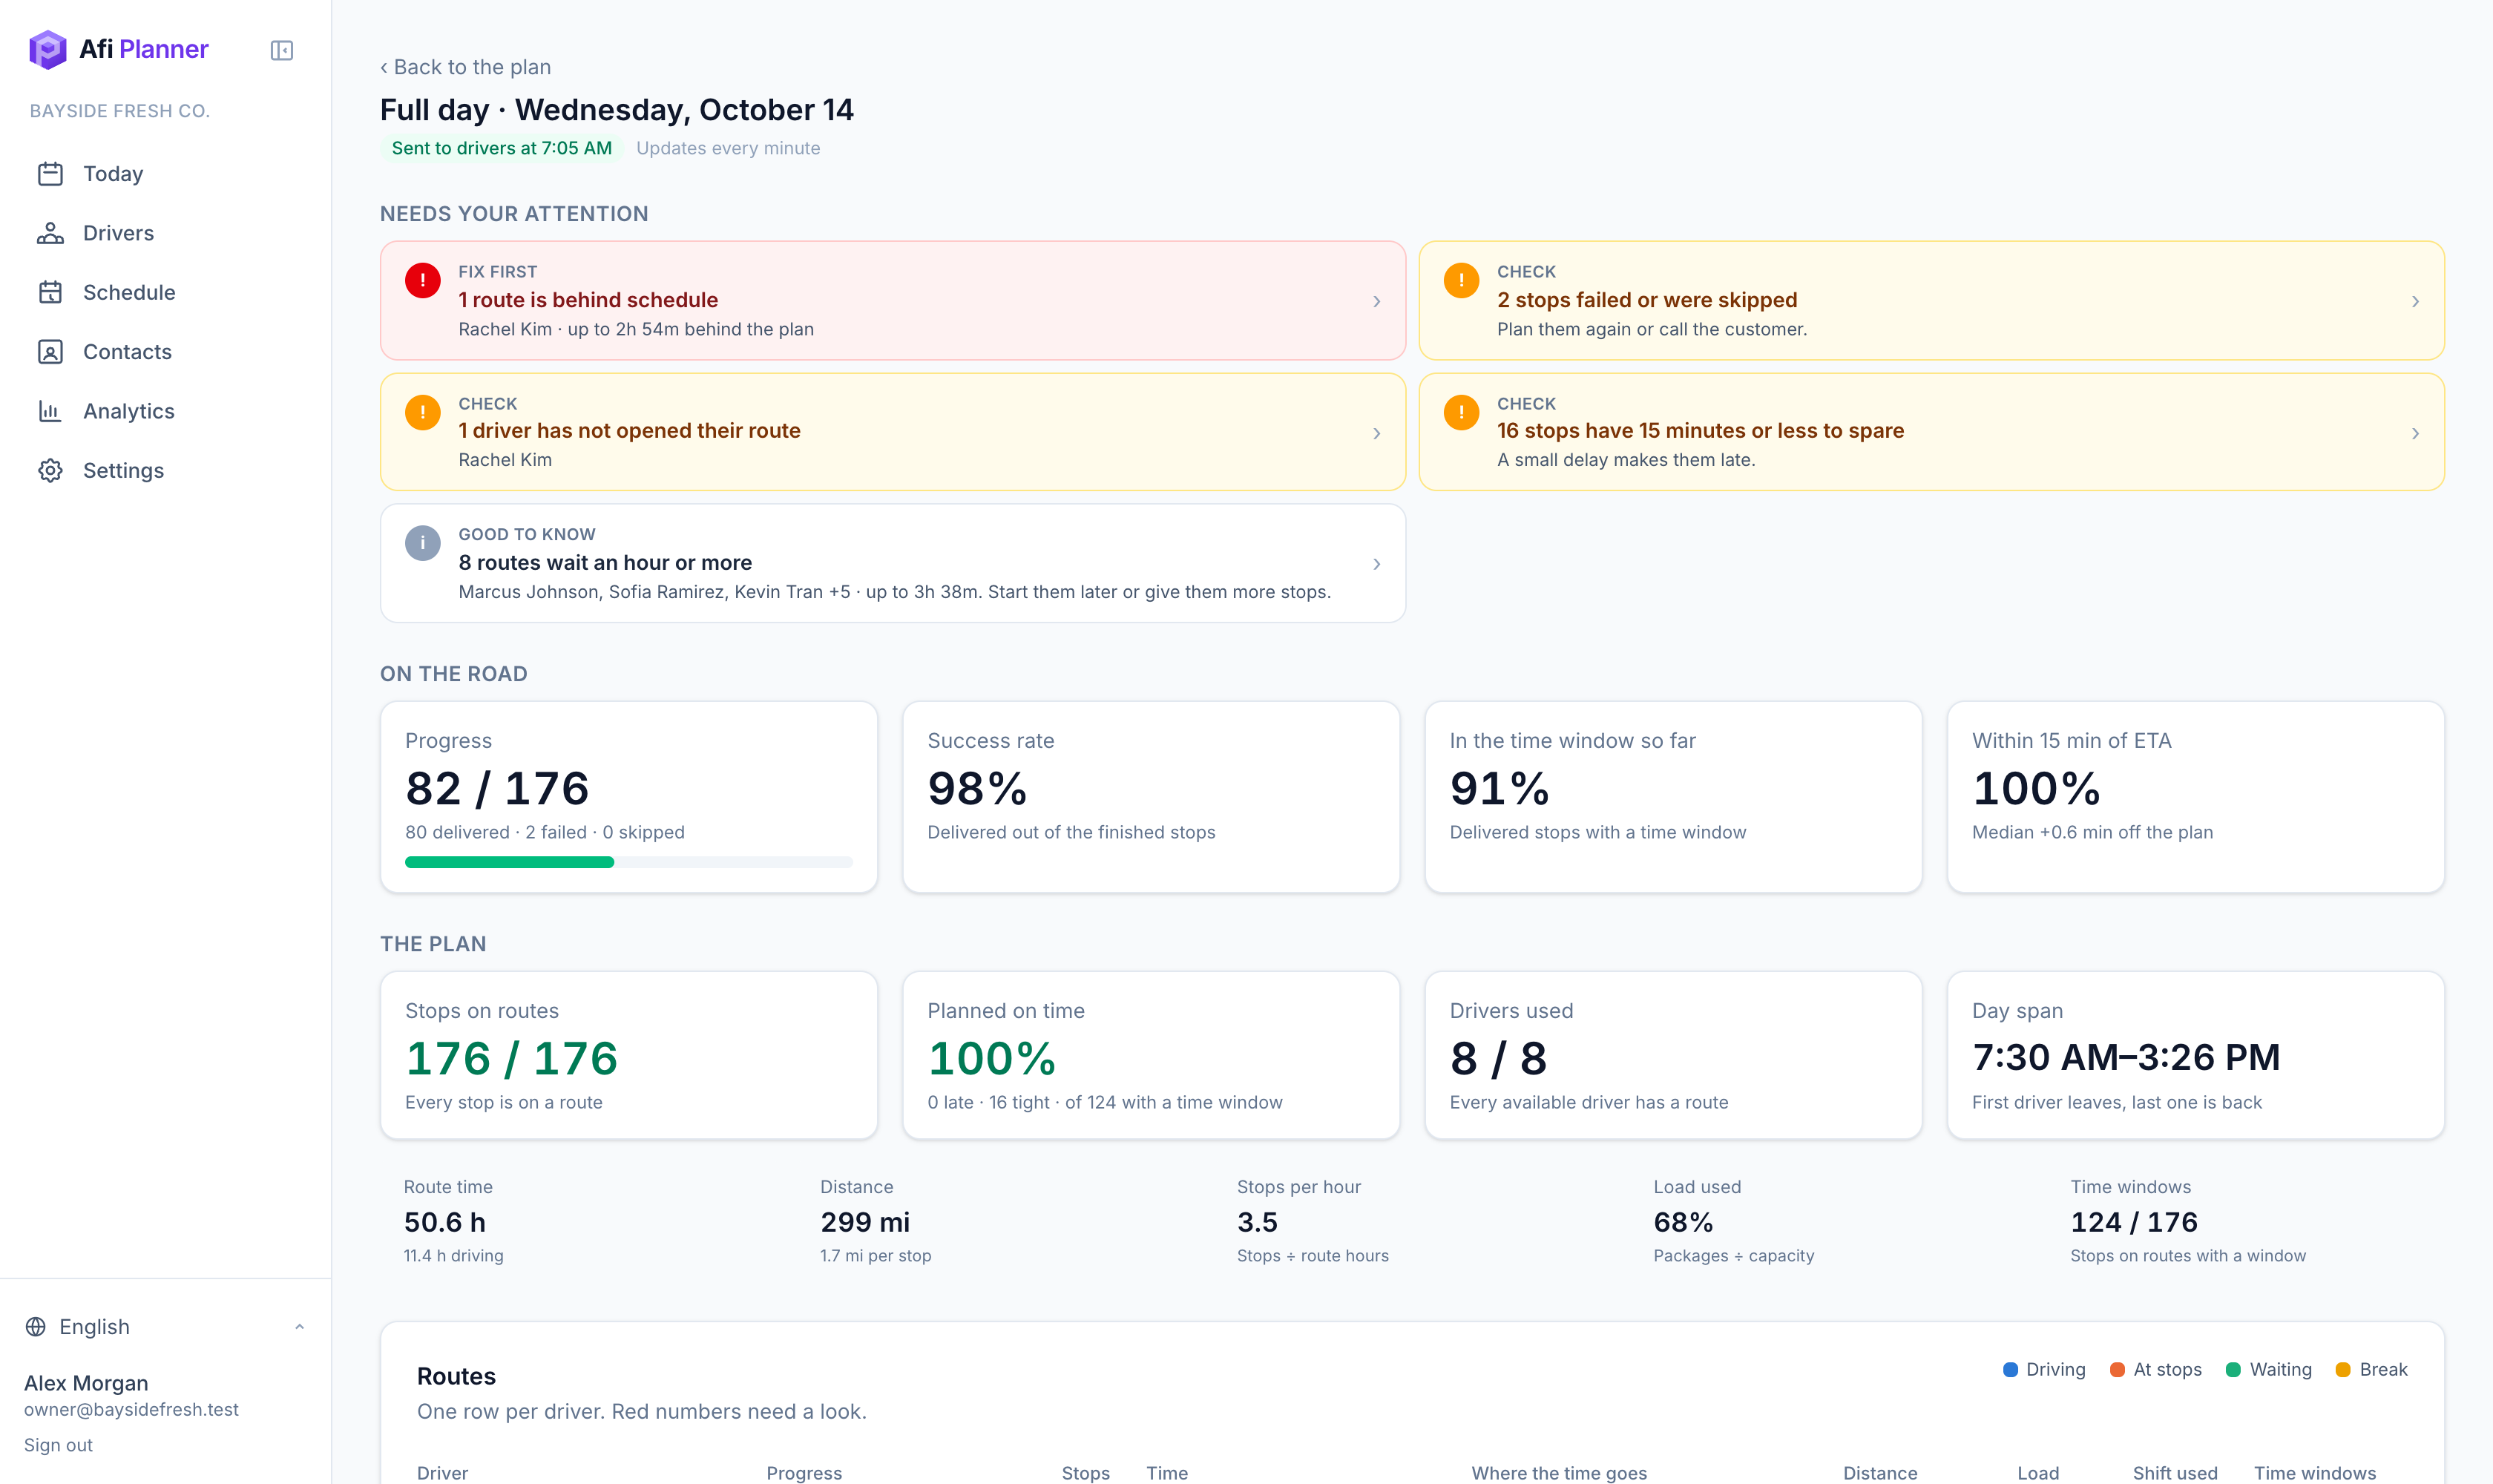
From any day, open Analytics for that plan: alerts first, then each route’s time split, load and shift use.
Step 4: Export
Download Excel from Analytics (By day, Drivers, Orders) or from any day (routes and stops). Print run sheets per driver.
Related feature
See how every route really went →